12 Plots and Paperwork
12.1 Plots
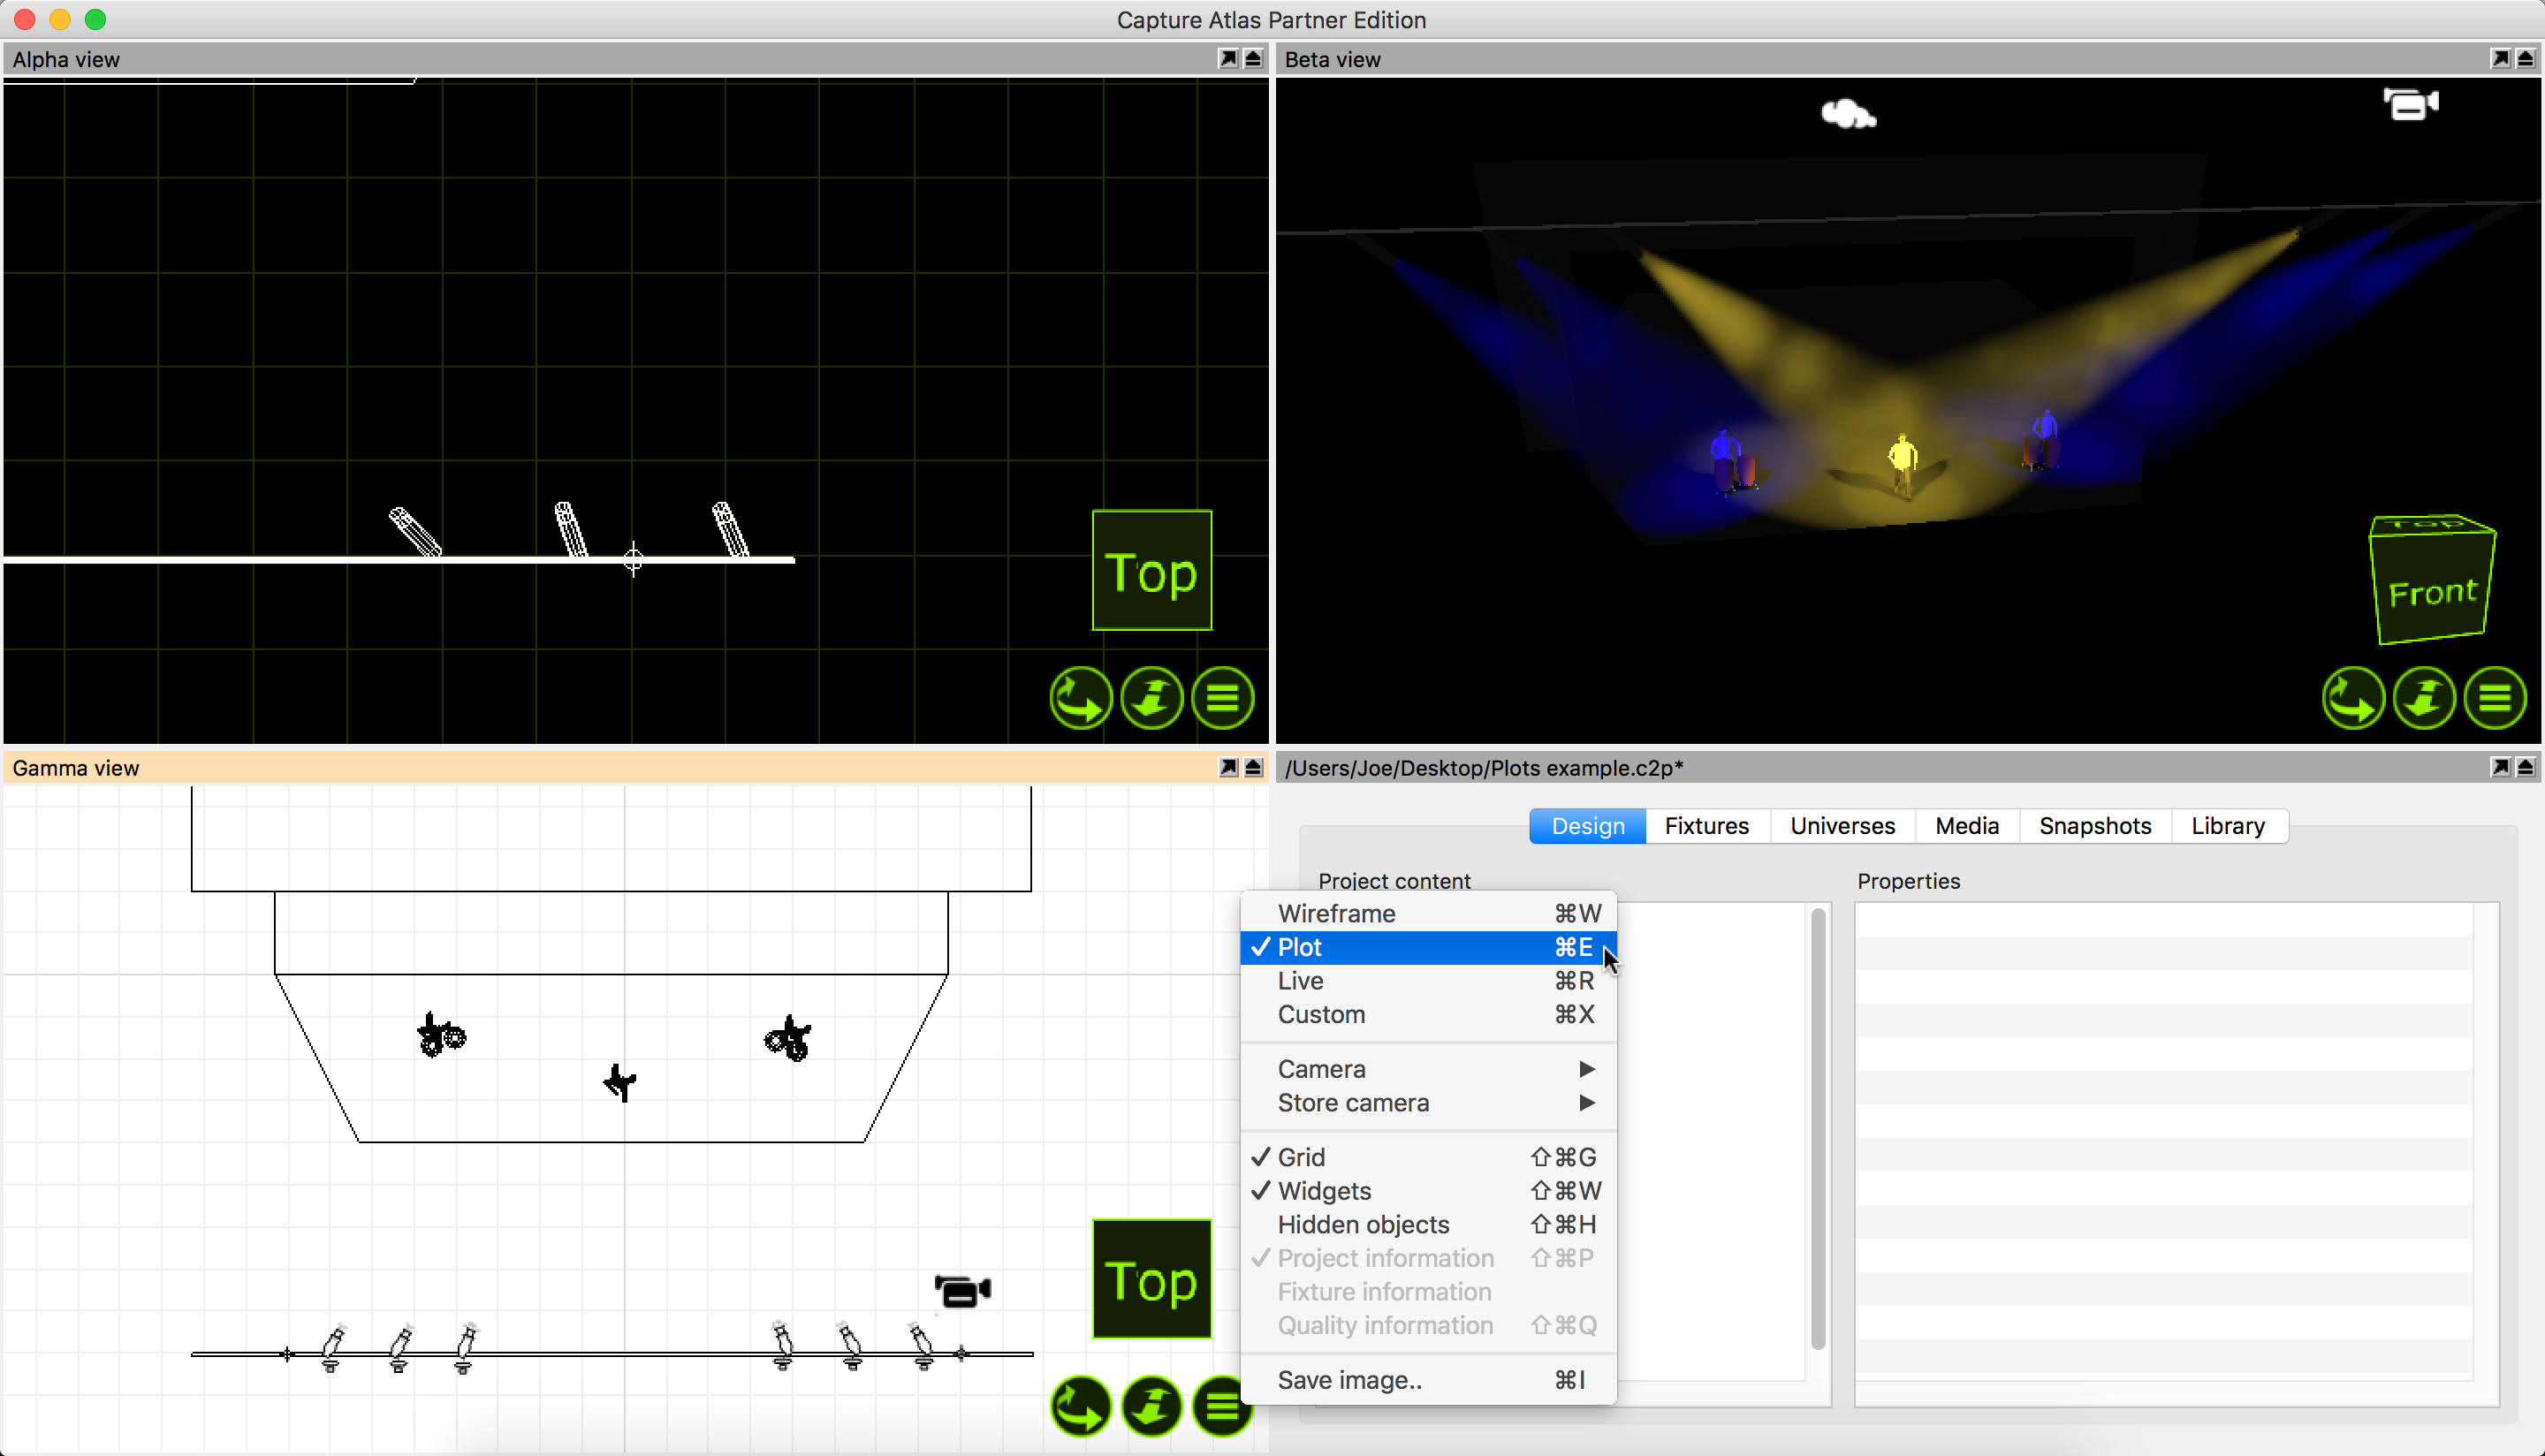
The plots functionality in Capture allows users to create paperwork of lighting plots featuring key information about the lighting rig. A plot can be viewed and edited in any design view that is orientated to the top view & plot mode, as shown below.
12.2 Plot Options
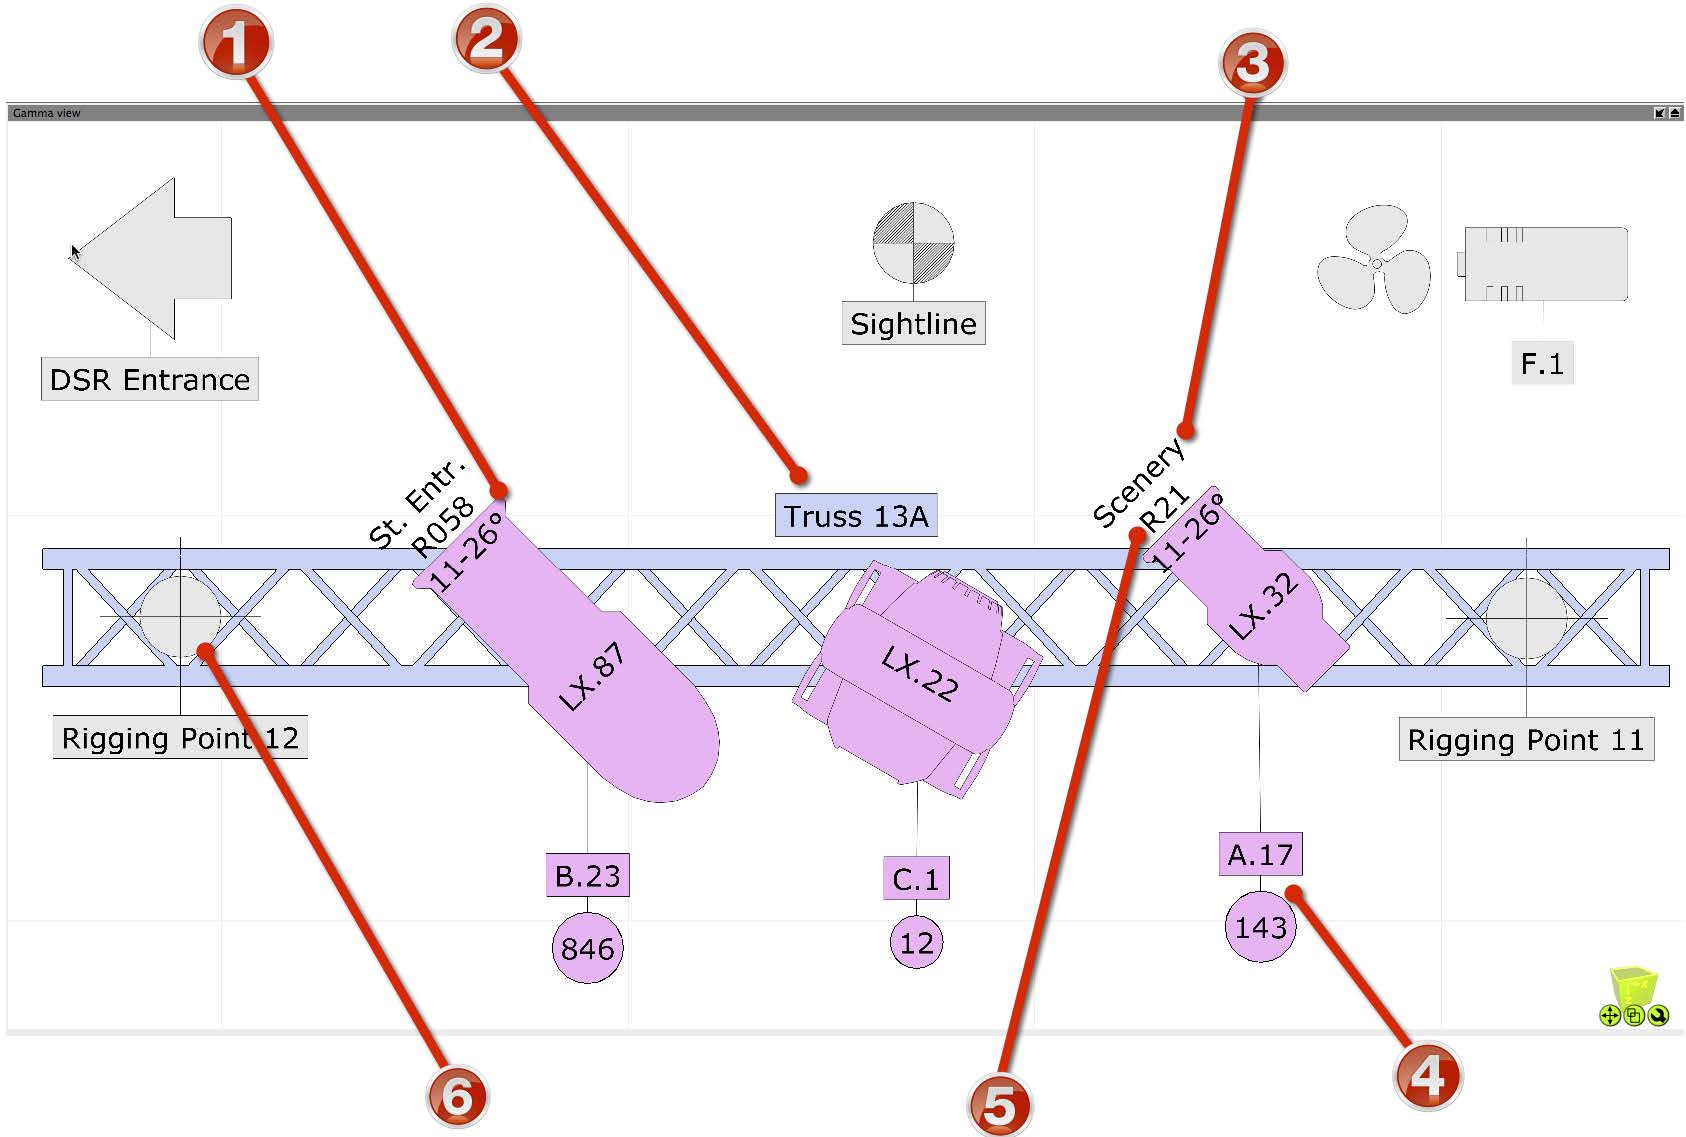
Other than Fixture symbols, there are many other symbols that can appear on plots. The interactive image below shows examples of the available plot symbols. Symbols such as Sightlines, Fans, Fog Machines, Rigging Points etc may all be dragged into the project from the library just like other items. If you are unhappy with the default symbol for a fixture, you may drag a different symbol from the library to the selected fixture.
| Item | Description |
|---|---|
| 1 | Optical information |
| 2 | Annotation |
| 3 | Focus information |
| 4 | Patch & circuit information |
| 5 | Colour filter information |
| 6 | Rigging point |
12.3 Fixture Properties with Plots
When fixtures are selected, there are some plot specific properties that are useful to know about.
Symbol will control which symbol is used on the plot for the selected fixture.
Symbol Usage will control which views the symbol actually appears in.
Direction snap is set to 30 degrees by default, this property controls the direction the fixture is facing on the plot.
Color by filer will set the fixture color to match the gel filter it has.
Focus is the property that allows text to be placed in front of the fixture to indicate where that fixture is focused. Ie, drums.
Show Optics is the property that controls whether or not the plot displays the optical information of the fixture.
Show Wattage is the property that controls whether or not the plot displays the wattage information of the fixture.
12.4 Plot Styles
With Capture Argo, there is now an option to create styles for use with specific plots later. There are multiple properties that can be included in a style, which can toggle on and off.
12.5 Exporting Plots
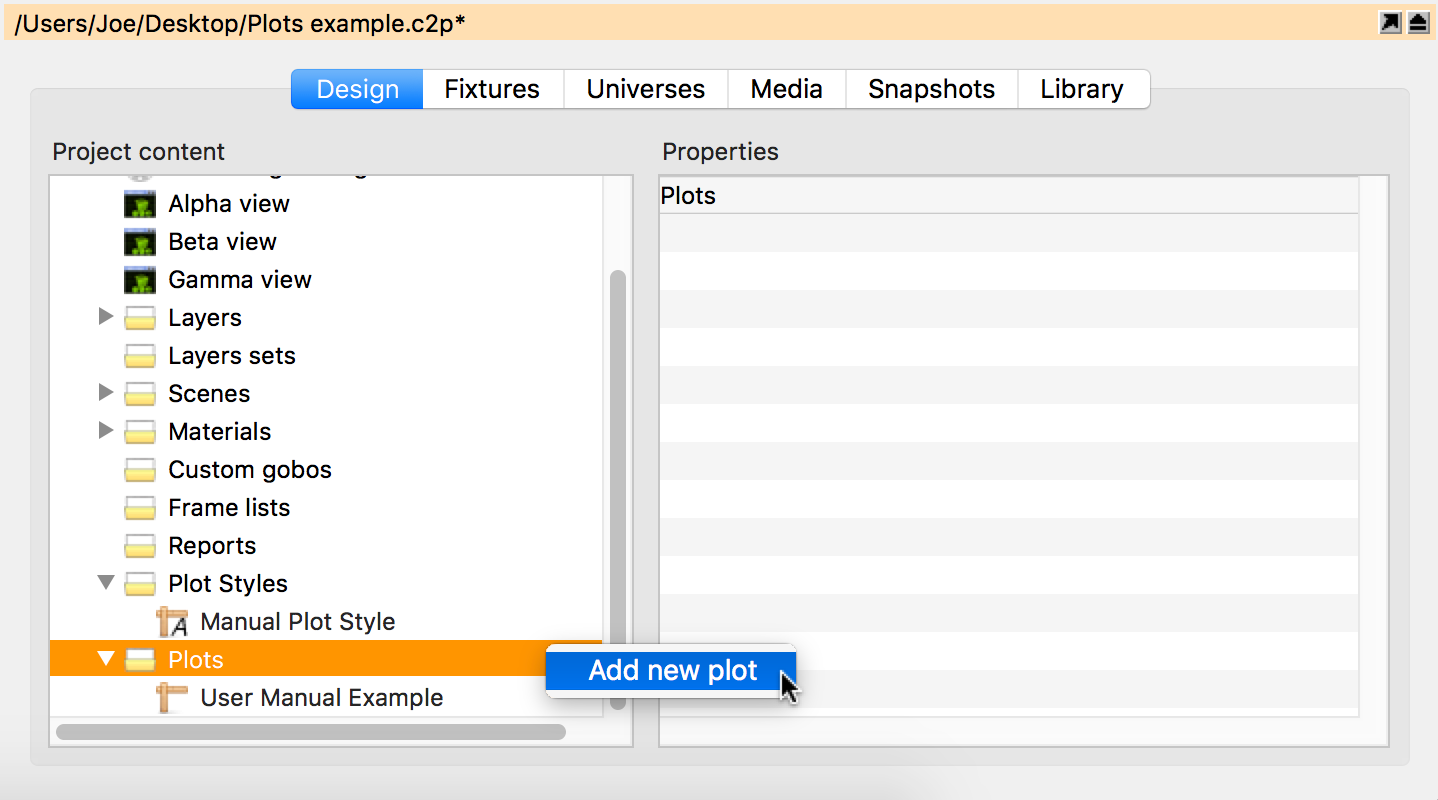
Once a plot has been made in a paper design view, it can then be exported for print. To do this, create a new Plot by right clicking on “Plots” in the Project Window and clicking “New”. Multiple Plots can be added in this manner. Adding multiple plots to the same project file is very useful for creating tidy plots for only certain parts of a rig. Each Plot can be setup to show only certain layers based on the filter you select for the view.
Once you have added a plot in the Project Window. Double click on it to open it. The paper settings can be changed in “Page Setup”.
Right clicking on the plot will allow you to add a view to the plot as shown in the image below. You may also add Headers, Images, Text, Layer Keys and Symbol Keys in the same manner as adding a view.
Scale and move the plot to suit the paper.